

AVAX Price Analysis: Bearish Momentum Persists as Traders Look for Buying Opportunities
Key Insights:
- Despite hopes, AVAX is met with opposition at the current price of $18.56.
- Increasing selling pressure is verified by the MFI, confirming the bearish trend.
- AVAX is getting close to oversold territory, signaling that traders should be cautious.
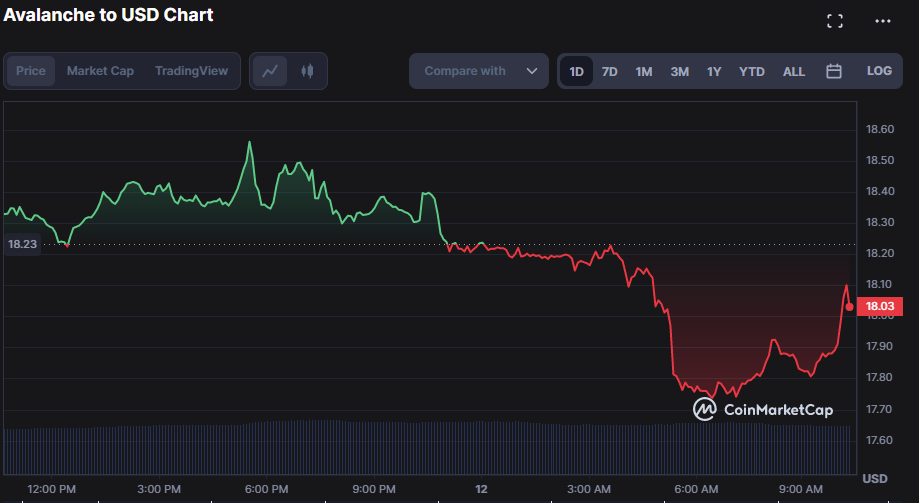
Despite initial positive efforts to change the market trend of Avalanche (AVAX), which encountered resistance at the day’s high of $18.56, the bears took over and pushed the price down to $17.73, marking its lowest point in the past 24 hours.
AVAX was valued at $18.05 at the time of writing, indicating a 1.02% decrease from its previous closing. The current condition of the market, coupled with fluctuations in the cryptocurrency market, might be the reason for this decline, as the price of BTC oscillates between 29k and 30k.
During the downturn, the market capitalization decreased by 1.00% to $5,889,579,864, whereas the 24-hour trading volume increased by 5.34% to $172,902,755. This indicates that some investors may have sold off some of their holdings during this time. However, there was also an uptick in purchasing activity from other investors who capitalized on the lowered prices.
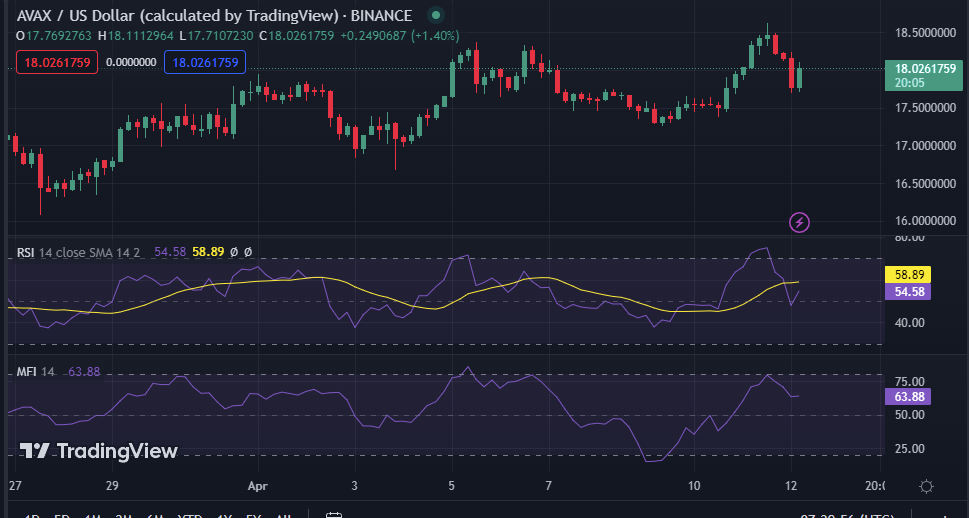
AVAX is experiencing a bearish momentum, as indicated by the Money Flow Index (MFI), which currently stands at 59.62 and shows a downward trend. This suggests that the selling pressure is intensifying. Traders considering long positions should be wary if the MFI continues to decrease and falls below the oversold level. This could indicate a more significant downward trend, and caution should be exercised accordingly.

With a current value of 50.85, the Relative Strength Index (RSI) is dropping below its signal line and entering the oversold area, indicating that there may be some short-term downward pressure for AVAX. As a result, traders may opt to wait until the RSI moves out of the oversold region and crosses above its signal line before considering entering an extended position.
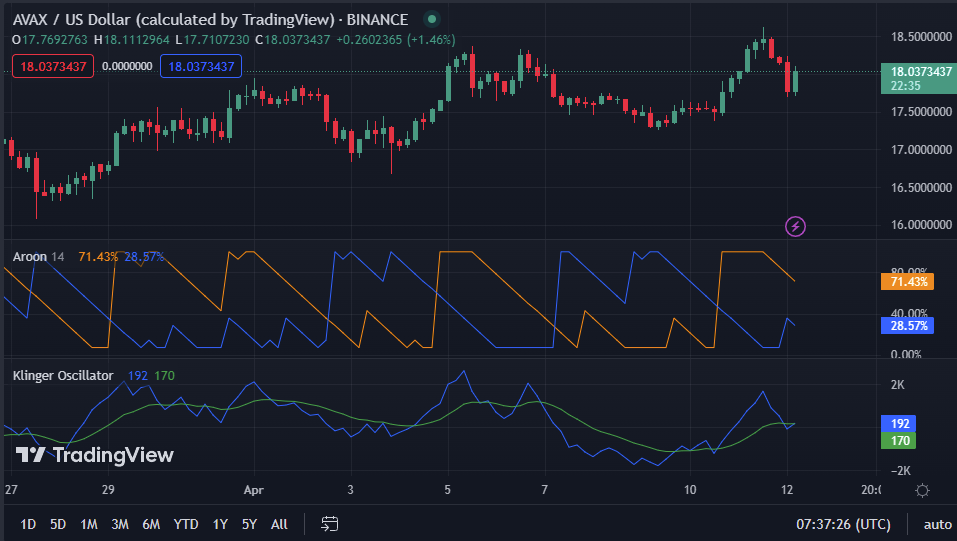
The AVAX market is steeply declining, as indicated by the Aroon up and down readings of 28.57% and 71.43%, respectively. The Aroon down value, which represents the strength of the downward trend, is much higher than the Aroon up value, which measures the power of the uptrend. This crossover implies a greater likelihood that the market will move downward shortly. The market is experiencing more selling pressure than buying pressure, as evidenced by the significantly higher Aroon down value.
The AVAX market’s 4-hour price chart shows the signal line at 94. The Klinger Oscillator is presently at -340, indicating a negative territory for the oscillator and its position below the signal line. These observations suggest a build-up of selling pressure in the market, creating a potential opportunity for investors to buy in.
Despite AVAX experiencing a bearish trend, many traders are still interested in the dip. With the increased trading activity, the AVAX market may be poised for a bullish run shortly.