

STX Market Surges: Possible Breakout or Trend Reversal?
- STX shows bullish momentum with potential resistance at $0.90.
- Bollinger bands indicate increased volatility and potential for range-bound behavior.
- Traders should watch for trend reversal signals with fading bullish momentum.
Due to heightened bullish vigor, the Stacks (STX) market has been listed as the top gainer by CoinMarketCap in the previous 24 hours. During this bull run, the STX price moved between an intraday high and low of $0.8873 and $0.7877. STX was priced at $0.8429 as of press time, representing a 6.75% increase over the previous day’s closing price.
If the resistance level at the 24-hour high is broken, the next barrier level to look for is at $0.90, which is a major psychological milestone for traders and investors and a possible indicator of continued positive momentum in the near term. If the bears grab control and drive the price lower, the next support level to watch might be around $0.75, where there may be some buying activity from investors trying to join the market at a cheaper price point.
STX’s market capitalization and 24-hour trading volume increased by 6.80% and 286.63%, respectively, during the upturn, reaching $1,158,015,782 and $148,257,064. This increase indicates that there is increasing demand for STX, and investors are optimistic about its future development, making it an appealing investment choice in the present market.

STX/USD 1-day price chart (source: CoinMarketCap)
The Bollinger bands on the STXUSD 2-hour price chart are broadening, showing the heightened volatility in the market. Traders may take this as a possible chance for prevailing transactions, but they should be wary of potential price fluctuations. While the top bar reaches 0.86878554, the bottom bar touches 0.76320688, indicating the currency pair’s “range-bound” behavior.
The price action movement toward the upper bar indicates that the bulls are in charge, and the currency pair can break over the resistance level at 0.86878554 and continue its upward trajectory. However, if the price fails to break above the resistance level, it might suggest a change in momentum and a probable trend reversal.

The Moving Average Convergence Divergence (MACD) is above its signal line at 0.00227220, indicating that the bullish trend in STX is expected to continue in the near term. Traders may purchase on dips near the support level in order to profit on future upward gains. The positive histogram motion indicates that the purchasing momentum is strong and might drive higher prices.
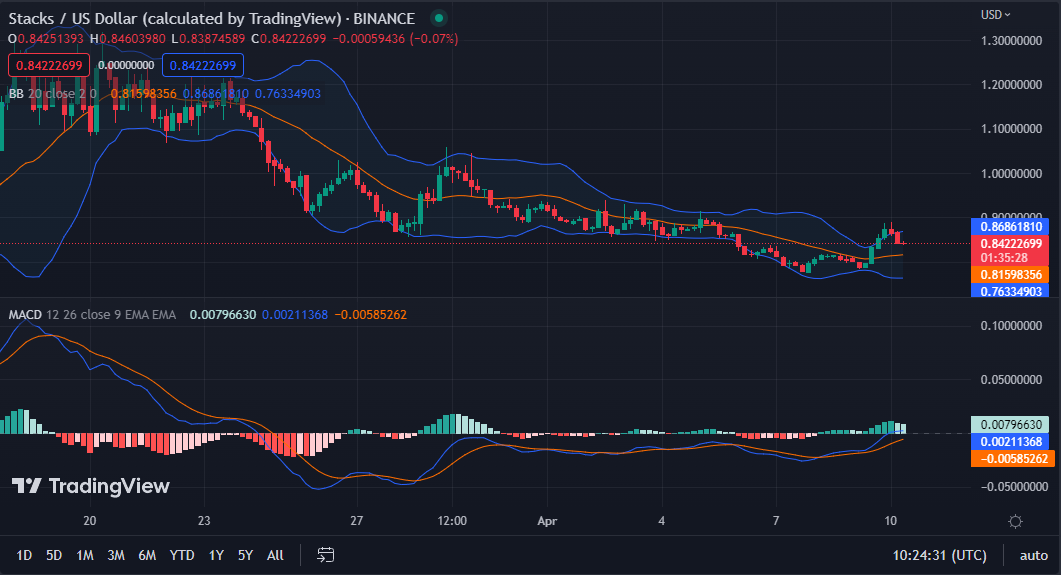
STX/USD 4-hour chart (source: TradingView)
On the STX price chart, the 200-day MA is 0.91521272, while the 50-day MA is 0.84644774, indicating that there has been a recent rally in the STX price, but the long-term trend remains favorable. This movement shows that traders should watch the STX price in the near term to see whether the current uptrend continues while also contemplating the possibility of long-term growth based on the 200-day MA’s positive trend.
Since the price movement has moved below both moving averages, traders may want to proceed cautiously before making any major investment choices.
While the Aroon up is 85.71%, the Aroon down is 50.00%, indicating that there is still some bullish momentum in the market, but it may be fading, and a trend reversal is possible. The 15.71% difference between the Aroon up and Aroon down shows that the present uptrend is losing momentum, and traders should watch the market for any signals of a possible reversal.

STX/USD 4-hour chart (source: TradingView)
In conclusion, STX’s recent bullish momentum has shown potential for continued upward movement, but traders should remain cautious and monitor the market for any signs of a potential trend reversal.